

We live in an era of digital distraction. When you search for something online, the Internet comes back with 99% garbage and (maybe) one or two relevant items. Until recently, we were expected to analyze the results ourselves to find the answer. Luckily, this is less and less the case.
Recent progress in the understanding of natural language makes it possible for a machine to understand precisely what the user wants, instead of identifying related topics. The machine can then answer questions directly.
How AI interprets our data today
Let’s take a look at how Google and Siri do it.
Try googling: “When did Airpods come out”. Check out the answer below—you don’t need to read the entire Wikipedia article to get the date because Google’s AI has already done it for you.
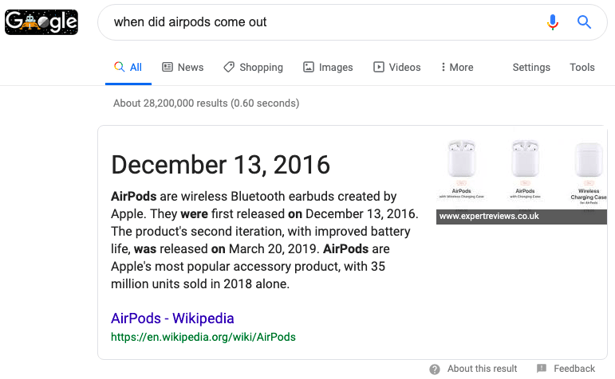
Screenshot of Google highlighting the short answer for when airpods were released.
Similarly, Siri will answer a question about a recent sports event with a direct response rather than a list of links to articles on the topic:
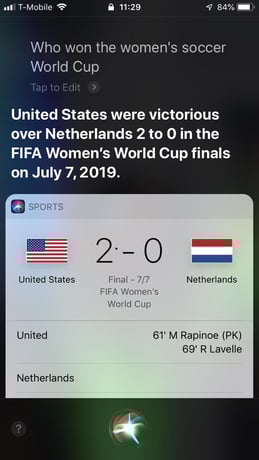 Screenshot of Siri's answer to the US team's score at the women's world cup.
Now let’s turn to data visualization in the enterprise. Dataviz is an essential tool for those in the business world to track financials, consumer behavior, market trends, and demographics. Here’s what a Dataviz dashboard looks like:
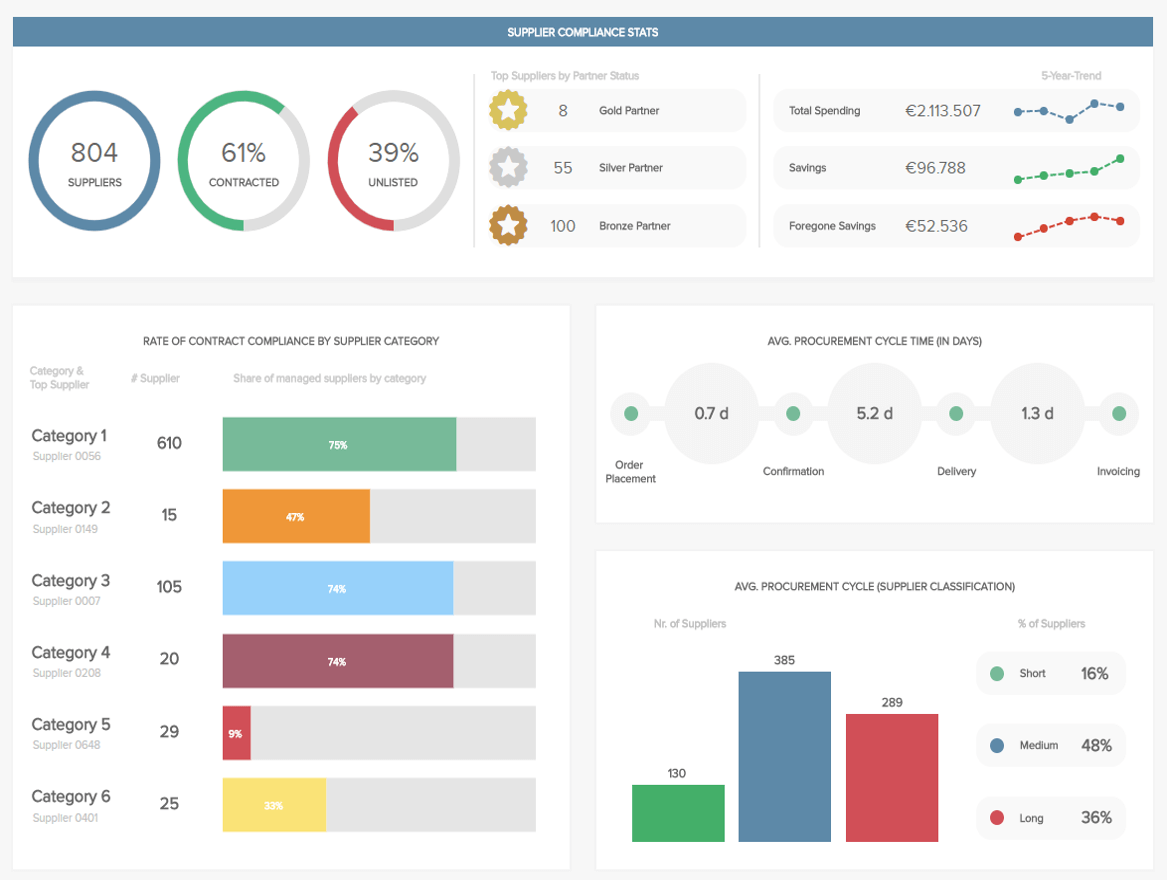
Screenshot of Dataviz dashboard showing various colorful graphs and charts.
Data visualization has become an art and a science. Researchers have been finding ways to make data as easy to interpret as possible.
Our instincts may tell us to fill a chart or graph with as much information as possible, but that can get increasingly overwhelming. A pioneer in the field, Edward Tufte, coined the phrase chartjunk to describe this phenomenon. When you need to access your third-quarter earnings, for example, you don’t want to sift through a chart full of random data for it.
So, what happens when humans no longer need to interpret data?
Recent advances in artificial intelligence make it possible to analyze your data and create insights tailored for your business. Programs like Einstein Discovery act as mechanized number-crunchers to scan through your information faster and more accurately than any human ever could. Machine Learning (ML) is a branch of AI that has also been explored by programs by Google Cloud, IBM Watson, and many more.
In short, ML programs are turning information into insights. So, do we still need data visualization in the age of machine learning? Or are data visualizations turning into chartjunk?
In many cases, your AI can process the data and answer a simple question with insights rather than generating a complicated series of charts and graphs that require further comprehension. Your machine has already “learned” from the raw input and generated insights for you. In that case, your interface with AI can shift from a demanding graphical user interface to a simple voice assistant.
Let’s put these theories into action to illustrate how we may best interface with ML. For instance: ask your voice assistant, “What’s my target demographic in Brazil this year?” This question is loaded with a subset of analytical metrics.
- Brazil = Geographical. Your AI will focus on consumer feedback from that nation specifically.
- This year = Temporal. You are asking for insights that pertain to trends and how each annual increase/decrease will predict this year’s market behavior.
- Target demographic = This one is a bit more nebulous, but if your AI has been educated on your business parameters, then it should know what products you sell, what your current flagship items are, etc.
Your voice assistant should be able to jump through the aforementioned digital hoops and generate insights along the following lines: Sales of fidget spinners in Brazil show a decline among millennial consumers but an increase in the Gen Z demographic. In one quick vocal exchange, you avoided cumbersome data visualizations in favor of a bottom-line answer. This is an example of how insights are now being derived by machine learning rather than costly human interpretation.
Increasingly, voice-enabled AI is the collective path forward. It allows us to democratize data, making it available to the masses without a tech “middle man” stepping in to give their spin on the raw numbers. Everyone can be an expert, which opens the floodgates for small businesses and entrepreneurs to wade into the refreshing waters of analytical enlightenment, courtesy of voice AI.
We used to think that a picture is worth a thousand words. What if a few words were worth a thousand dashboards?
Adrien Schmidt will be on two panels at VOICE: "How to Automate the Creation of NLP Models" on July 23rd, and "Accessible Data & Analytics: "How Voice Assistants Serve the Enterprise" on July 24th. Nab one of the last available tickets and connect with Adrien at the world's largest voice tech event of the year!


.png)